

5 B2B marketing metrics that actually tell you if it’s working
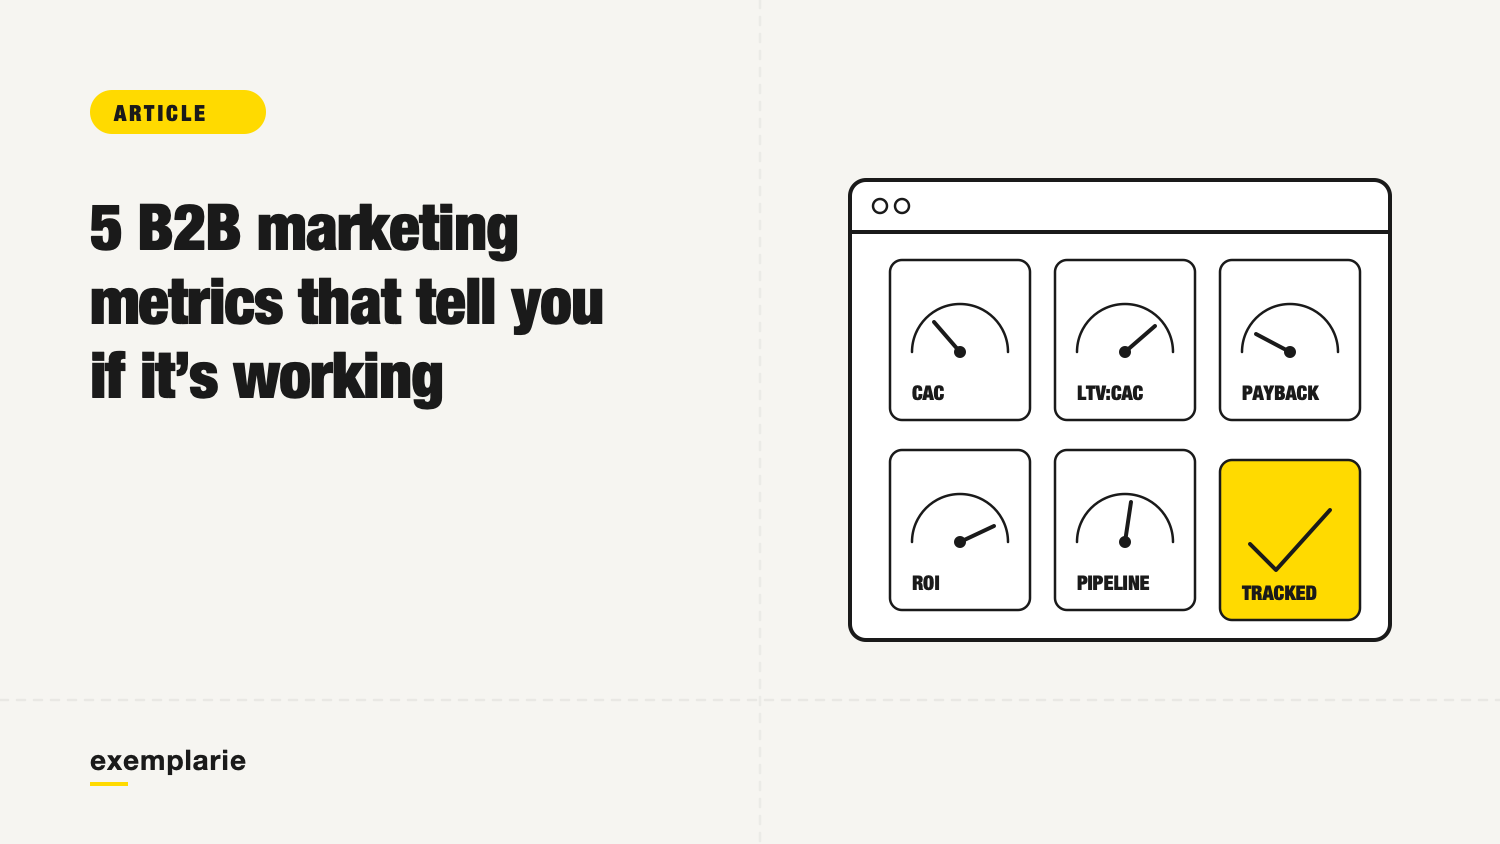
Founders track a lot of marketing numbers. Website traffic, follower counts, campaign counts, impressions. Most of these can look perfectly fine while the business is quietly losing money on every new customer it brings in.
A small set of metrics actually tell you whether marketing is working, not just whether it’s active. Here they are in plain terms, what each one means, and where the commonly cited healthy ranges sit for a funded B2B startup in 2026.
The 5 metrics worth actually tracking
1. Customer Acquisition Cost (CAC). What it costs, on average, to acquire one paying customer, including marketing spend and often sales costs too. There’s no single “healthy” CAC in isolation, a $2,000 CAC is fine for a $50,000 deal and a problem for a $3,000 one. CAC only becomes meaningful next to the two ratios below.
2. LTV:CAC Ratio (Lifetime Value to Customer Acquisition Cost). How much a customer is worth over their lifetime, compared to what it cost to acquire them. 3x or higher is a commonly cited healthy range; below 2x usually means you’re not making enough back per customer to acquire them sustainably.
3. CAC Payback Period. How many months of revenue it takes to earn back what you spent acquiring a customer. Under 12 months is commonly considered healthy; 12–18 months is worth watching; over 18 months often signals a costlier acquisition motion than the business can sustain.
4. Marketing ROI (Return on Investment). What marketing is generating relative to what it costs, as a simple sanity check alongside the two ratios above. Above 50% is generally considered healthy for B2B; below 0% means you’re spending more than you’re generating back.
5. Churn Rate. The percentage of customers (or revenue) you lose over a given period. Under 5% annualized is commonly considered healthy; above 10% is often a red flag for retention.
Why “healthy” depends on your stage
A pre-seed startup with a 15-month payback period isn’t necessarily in trouble. A Series B company with the same number probably is.
Industry data puts the median B2B SaaS CAC payback period at around 16 months, with top-quartile companies recovering it in 6 months or fewer. A 3:1 LTV:CAC ratio is widely cited as the baseline for sustainable B2B SaaS growth, with top performers reaching 4:1 or higher.
Earlier-stage companies are often still paying a premium to learn who their best customers are. That’s expected. What matters more is whether the number is trending toward healthy as you scale, and whether it’s the spend that’s the problem or something underneath it.
Where these numbers usually go wrong
- CAC is calculated on marketing spend alone. Leaving out sales costs, tools, and team time makes CAC look better than it actually is.
- LTV is estimated instead of measured. An optimistic churn assumption can make a mediocre ratio look healthy on paper.
- The time period doesn’t match. Mixing a monthly CAC with an annual LTV, or vice versa, quietly breaks the math.
- The benchmark is borrowed from the wrong context. Enterprise SaaS benchmarks don’t apply cleanly to a self-serve SMB motion, and vice versa.
| Metric | Healthy | Worth watching | Needs attention |
|---|---|---|---|
| CAC | No single healthy number: judge it next to LTV:CAC and payback | ||
| LTV:CAC | 3x or higher | 2x to 3x | Below 2x |
| CAC payback | Under 12 months | 12 to 18 months | Over 18 months |
| Marketing ROI | Above 50% | 0% to 50% | Below 0% |
| Churn (annualized) | Under 5% | 5% to 10% | Above 10% |
Getting the inputs right matters more than getting a good-looking number. A healthy ratio built on the wrong inputs isn’t actually healthy.
How to actually calculate these yourself
None of these require special tools, just consistent inputs over the same time period.
- CAC = total marketing (and sales, if you’re including it) spend over a period ÷ number of new customers acquired in that period.
- LTV:CAC Ratio = customer lifetime value ÷ CAC.
- CAC Payback Period = CAC ÷ (average monthly revenue per customer × gross margin).
- Marketing ROI =
- Churn Rate = customers lost during a period ÷ customers you had at the start of it.
The tricky part usually isn’t the formula, it’s keeping the time period and inputs consistent across all five. If you’d rather not do that by hand, our Marketing Health Calculator runs these same calculations for you and color-codes the result against these ranges.
Track these five consistently and you’ll usually know whether marketing is working long before a slow quarter forces the question. The formulas are simple. The discipline of using them the same way every time is the actual hard part.
If your numbers raise more questions than they answer, here’s a natural next step.

Want a second pair of eyes on what’s broken?
